While there is a lot to unpack from the preliminary NTSB report on CommuteAir 4339, consider the following statement:
"...determined that they would have a margin of approximately 200 feet..."
If I ever stake my life and career on a margin of 200 feet, I better know how those performance calculations work inside and out.
Actual Landing Distance - The distance from the point at which the main gear of the airplane is 50 feet above the landing surface (the threshold) to the position of the nose gear when the airplane is brought to a stop. The exact specifications are found in 14 CFR 25.125. Advisory Circular 25-7 goes into even further detail.
Landing Field Length - From 14 CFR 121.195(b), the destination must have a runway long enough that you only plan to use 60% of it's length.
Wet Landing Field Length - From 14 CFR 121.195(d), if the runway might be wet or slippery at the time of arrival, the runway must be 115% the minimum Landing Field Length.
$$\text{Landing Field Length} = 1.67 \times \text{Actual Landing Distance}$$ $$\text{Actual Landing Distance} = 0.60 \times \text{Minimum Landing Field Length}$$
In my aircraft, a CRJ700, I calculate at a max landing weight of 67,000lbs, 1000' elevation, and wet runway, an Actual Landing Distance of about 3,700'. The landing distance available at KROA, Runway 34 is 5810'. The lighter EMB-145 probably needs even less distance.
The dry landing performance is 3120', multipling this value by 1.67 yields the Landing Field Length of 5211'. Multiplying this by 1.15 yields the Wet Landing Field Length of about 6,000'.
Landing with a real 200' margin is risky.
Landing with a 200' margin of a 60% margin plus a 115% margin requires professionalism, but it's just business.
AFM - Landing Field Length and Vref, Flaps 45 considering weight, altitude, HW/TW, wet or dry, normal and 1 antiskid ch inop. There are two charts and they come in the form of a nomogram (like the eye tests in a Piper Cherokee AFM).
QRH Vol 1 - Actual Landing Distance and Vref. Includes flap settings other than 45, two, one, or no thrust reverse, standing water/slush/wet snow, dry snow, compacted snow, and ice. Then it goes further combining all combinations of contaminant with different settings of flaps (because it's just your luck, the flaps are going to freeze during severe winter weather). It also provides data for one anti-skid channel inop. These charts come in the form of tables.
My company uses a third party to make performance calculations. Landing distances are calculated based on forecast weather, conditions, weights, etc... and included in the dispatch release. These values are used for planning and legal purposes. From the pilot perspective, we only use them as a backup.
In flight, we resend for the landing distances with more up to date weather and conditions for more accurate numbers. The inputs and results are sent and received from the flightdeck MCDU (a keyboard and screen) using the ACARS computer (a wireless networking computer). It takes one to two minutes and works most of the time.
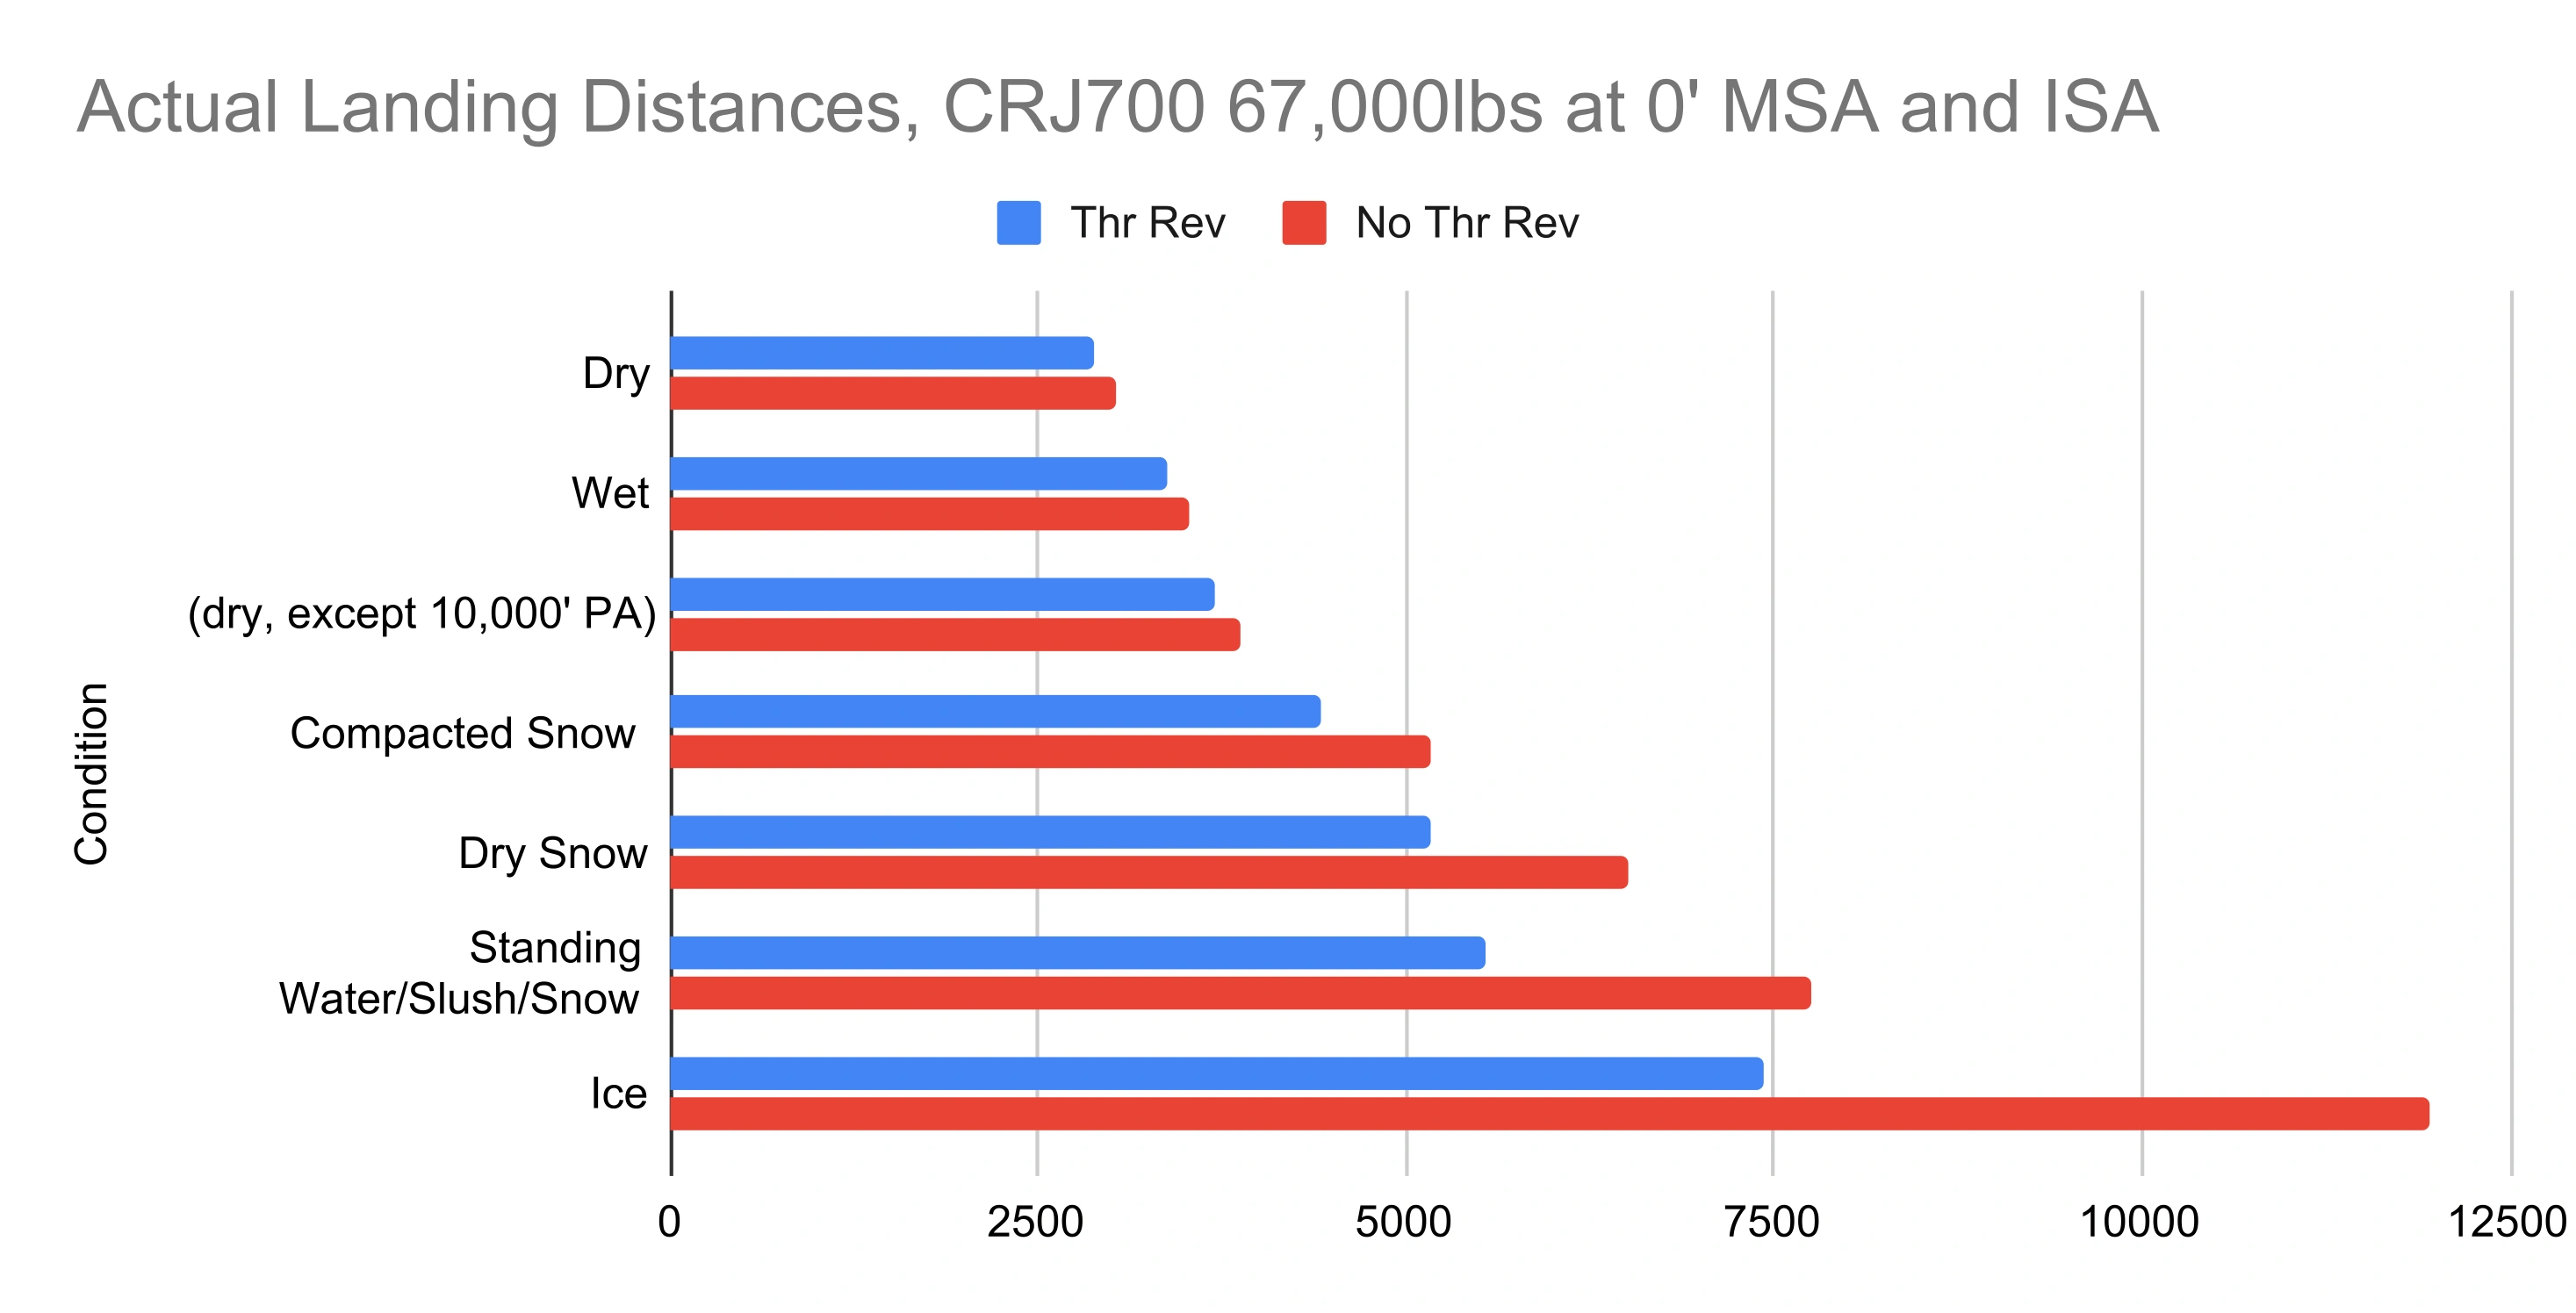
Here is a chart of actual landing distances for a CRJ700 at 67,000lbs over a variety of runway conditions. These values are for 0' pressure altitude and ISA conditions except for the one at 10,000' pressure altitude which I threw in for comparison.
The following is the same chart, but I translated the conditions to the most applicable RCC value using the RCAM.
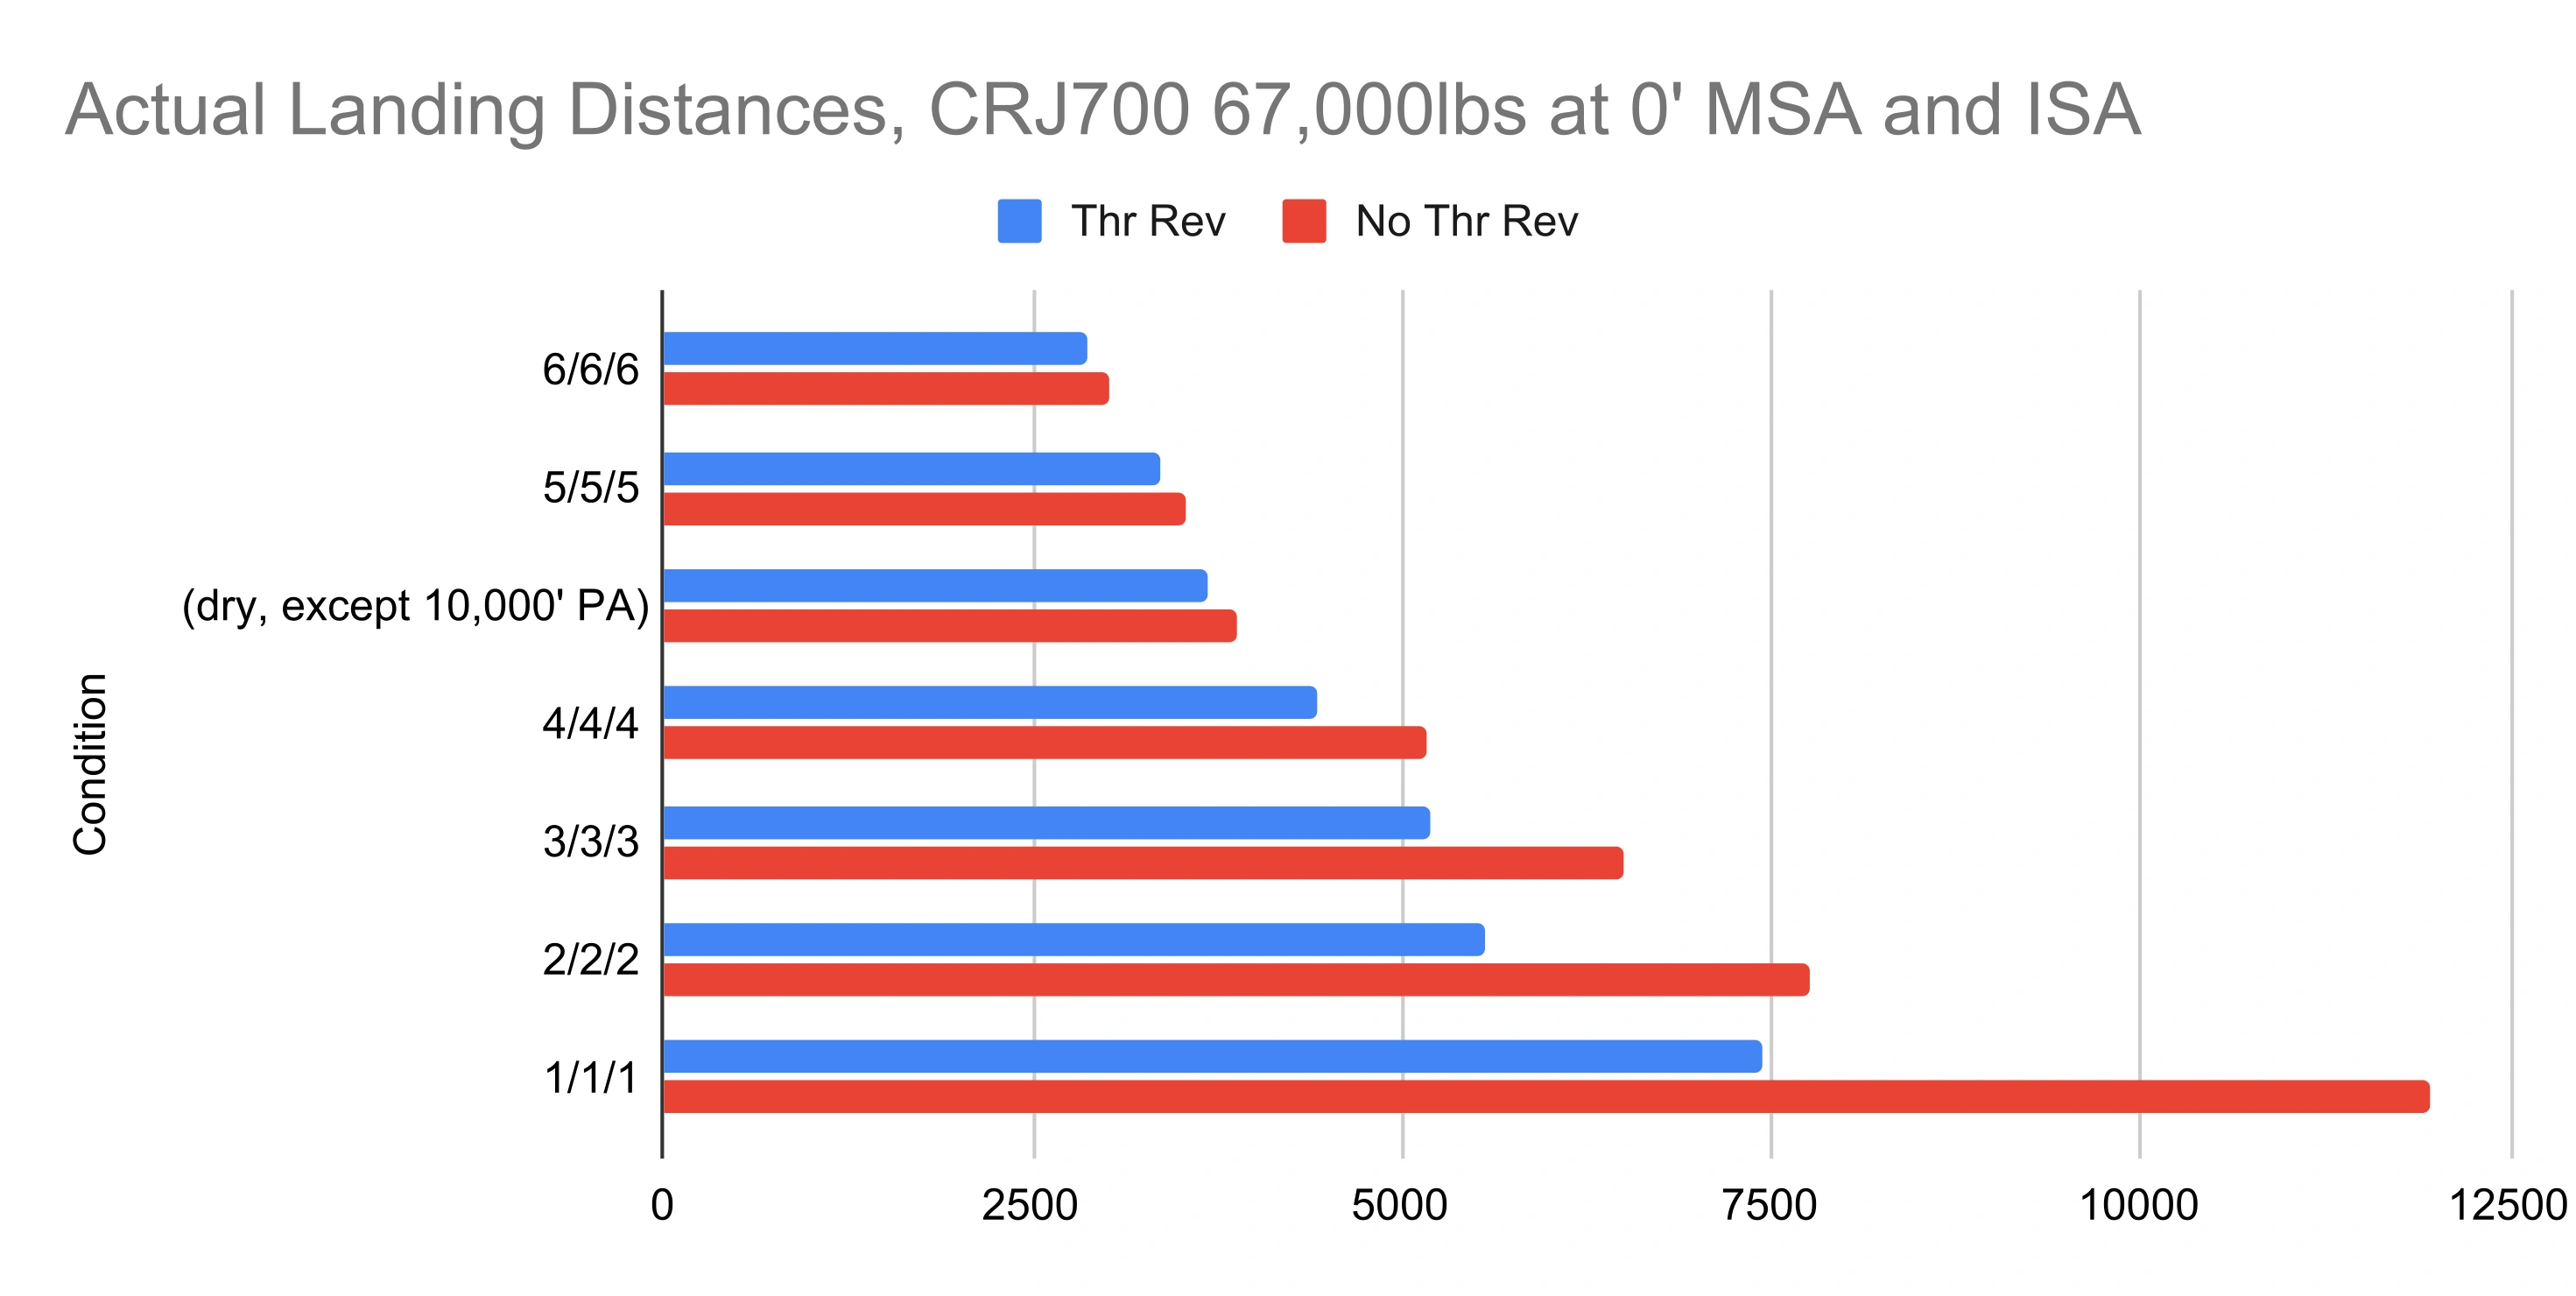
Starting with RCCs of 4s and degrading, thrust reverse really starts to show it's value to landing performance.
From AC 25-32
5.4 "Part 25 landing distances are determined in a way that represents the maximum performance capability of the airplane, which may not be representative of normal operations"
Regulations for flight testing landing distances are found in 14 CFR 25.125.
AC 25-32 is also where we find the phrase, "able to be consistently executed in service by crews of average skill".
For those who are cynical about the test process, the crash of Gulfstream N652GD makes for an interesting study. The crash occured during certification testing. The flight test team gradually gave in to business pressures to certify the aircraft for performance promises that were actually not possible. It lead to the development of abnormal maneuvers and excessive control inputs that ended in a fatal crash. The test flight crew believed they could grease the FAA certifying officials and certify the charts for extraordinary performance the aircraft was actually incapable of.
For maximum performance landings, I perform the landing as described by the manufacturer in the FCOM. I trust in the 60% margin required by 14 CFR 121.185(a) for dispatch and divert when circumstances change.
For a common landing in good conditions, brake application can be lightly applied somewhere below 100kts.
But for maximum performance landing, the brakes should be applied immediately once the nose wheel is down. They should be applied heavily, anti-skid will handle the rest.
The landing should be firm and minimize float.